Hi all – please see below a summary of data so far as well as sample results from 6 and 7 April 2025. Some interesting findings, observations and deductions: =and so that’s why I’m highlighting and separating these.
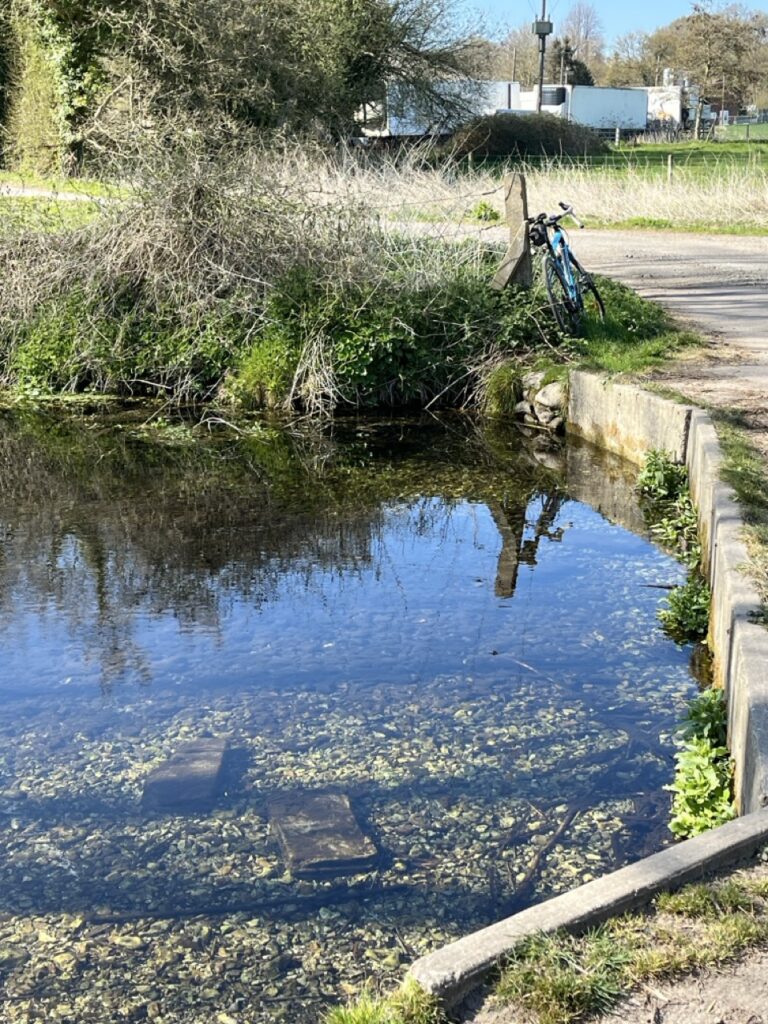
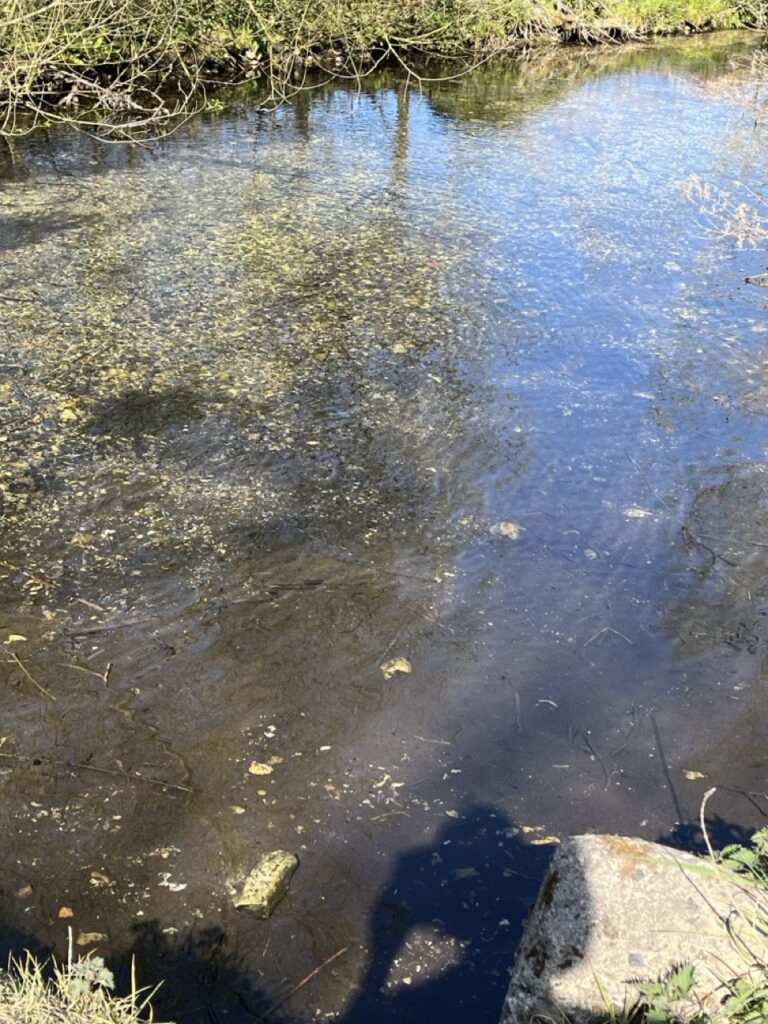
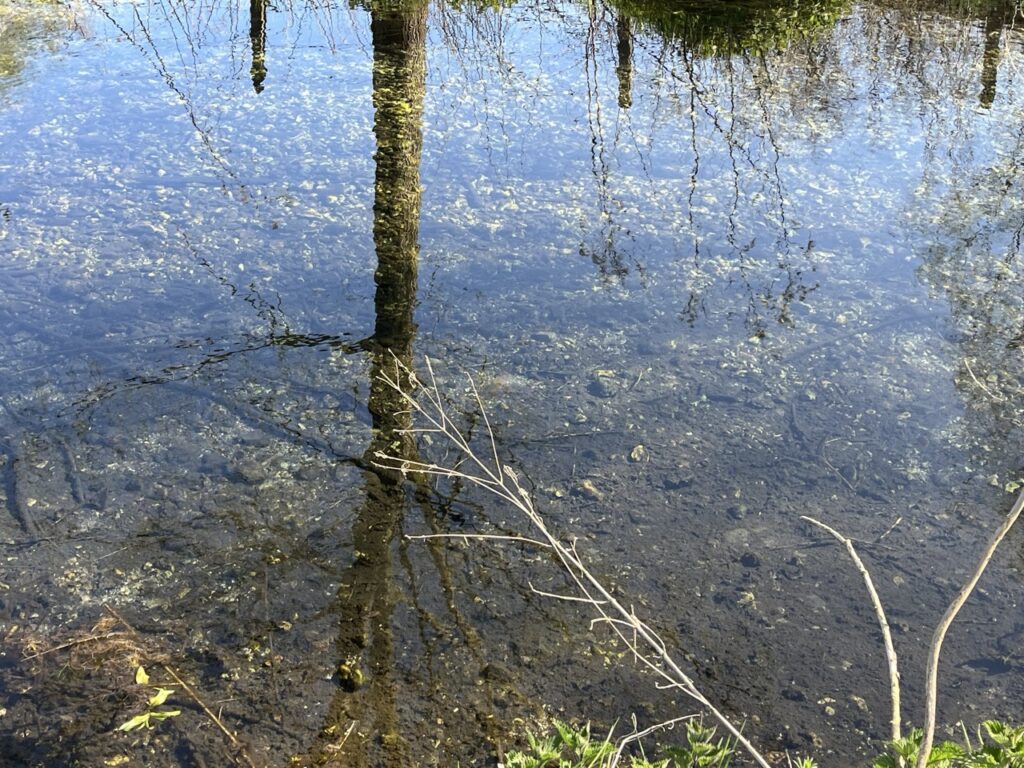
1. I can’t remember such a consistently dry period at this time of year for a long time and never since I started sampling. Yet groundwater levels are still quite high at >75m ( Little Bucket BGS data). This has meant (as I understand!) that our streams are still flowing well and indeed, even the Nailbourne is still flowing at Garrington. Stream flow rates were relatively fast although levels overall seemed down in some locations.
2 As a consequence of zero rainfall, run off from land into the stream has been greatly reduced or even absent. The fact that the results from this sampling show P and NO3 levels as consistently low along the stream and with relatively little variation (other than where there’s input from a treatment works), would seem to corroborate this. In contrast to sampling during ‘normal’ weather conditions, these results suggest greater variability in nutrients under normal rainfall conditions, where different locations will be affected differently by agricultural and other runoff.
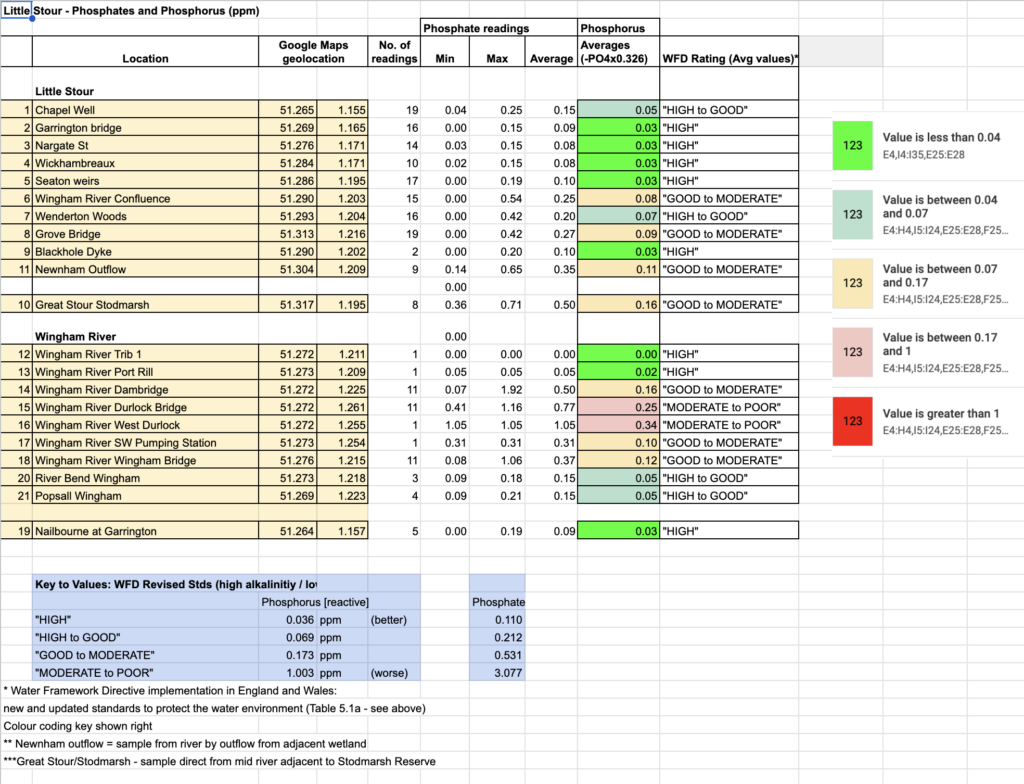
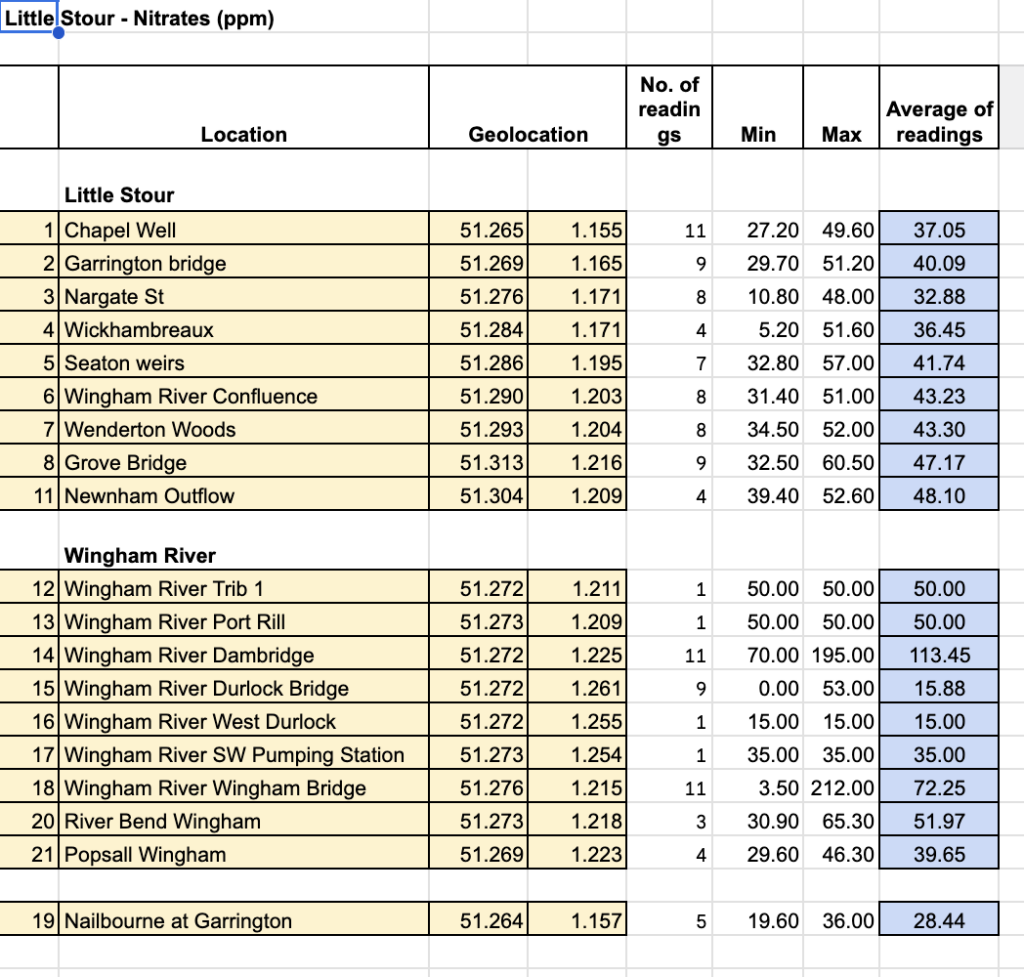
3. This more stable weather has also highlighted the change in water quality after the Wingham River confluence. Recent data from the Wingham group have shown consistently higher P and NO3 and a range of site-specific pollution issues (to be confirmed next sampling). Water clarity certainly gets murkier after this location.
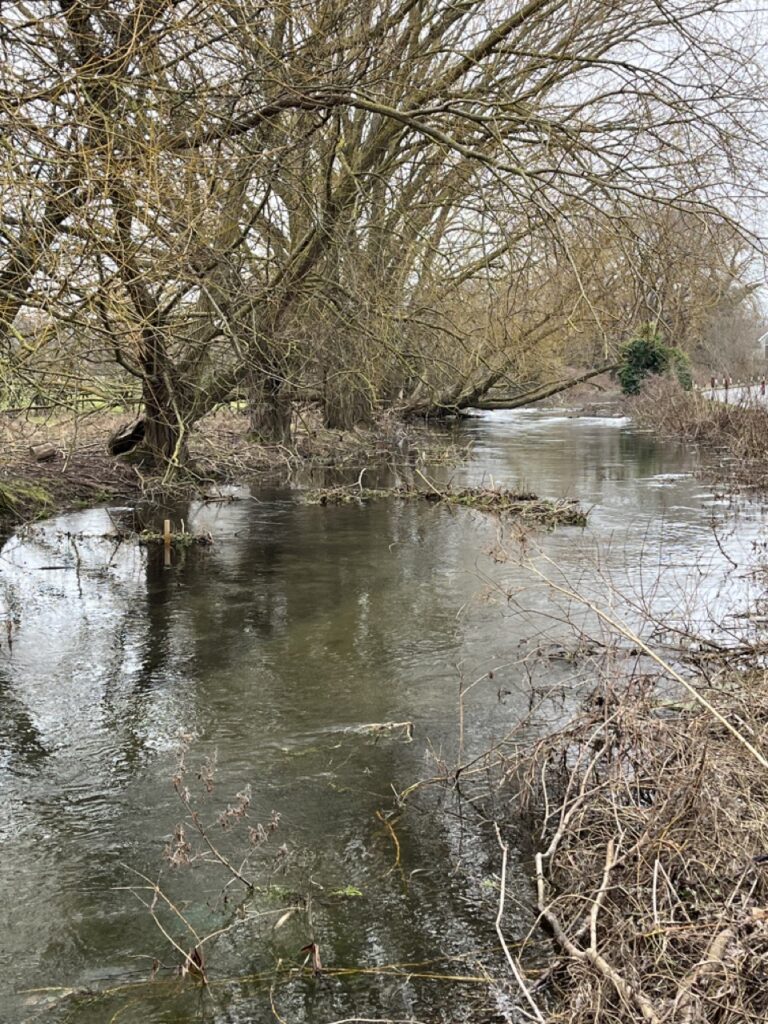
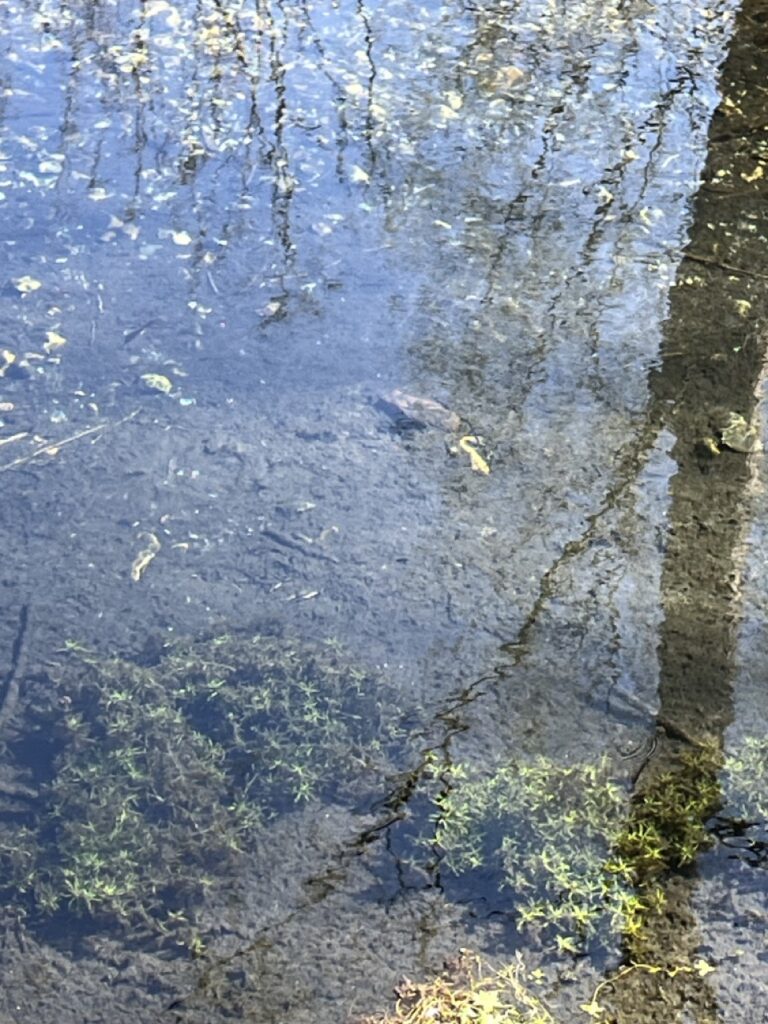
4. It was great to see several shoals of juvenile trout in several locations – Newnham Valley outfall, nr Blackhole Dyke and under Wingham Bridge as well as Garrington Farm bridge. I assume these are the fry from the active spawning several of us witnessed in Dec/Jan.
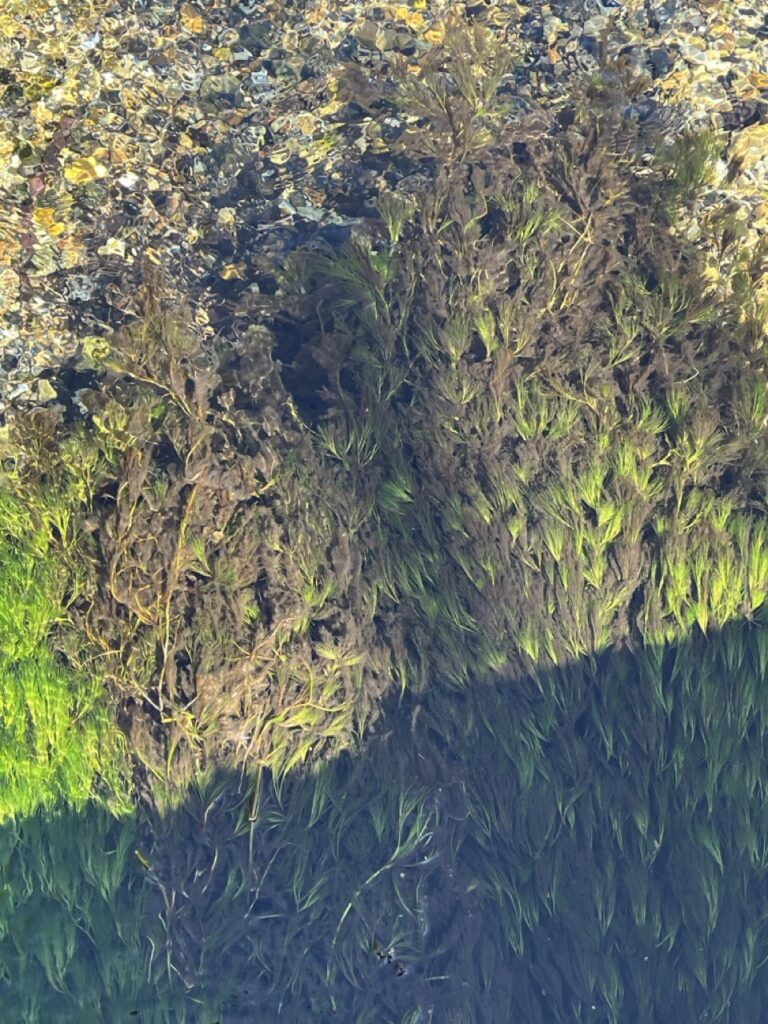
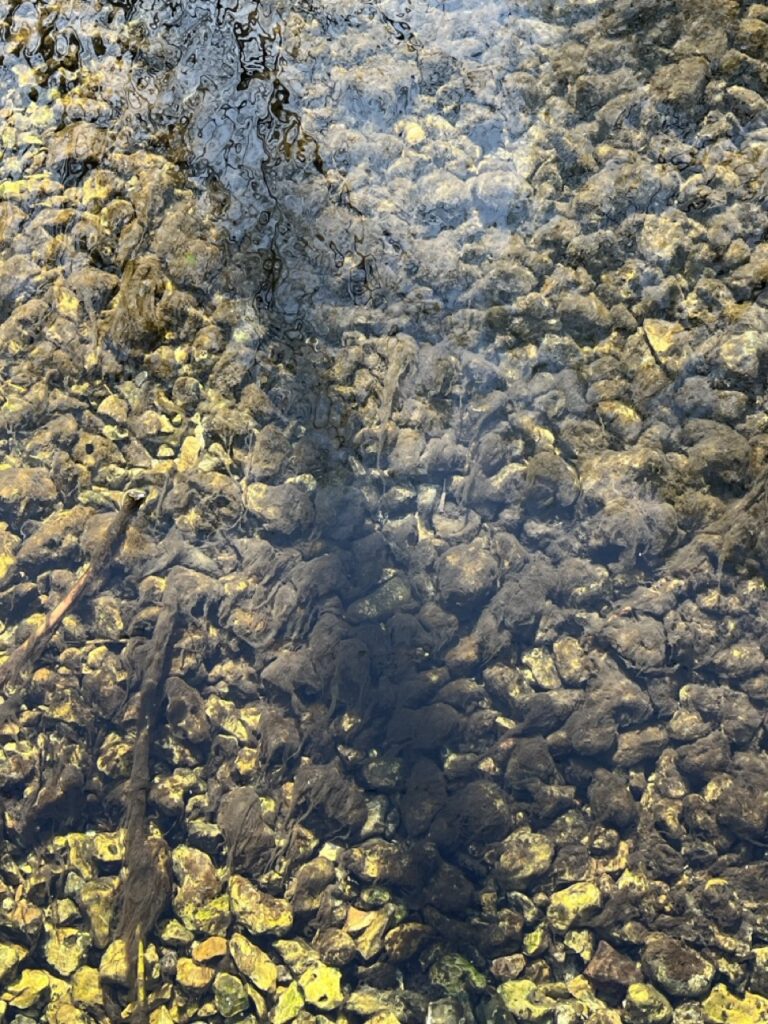
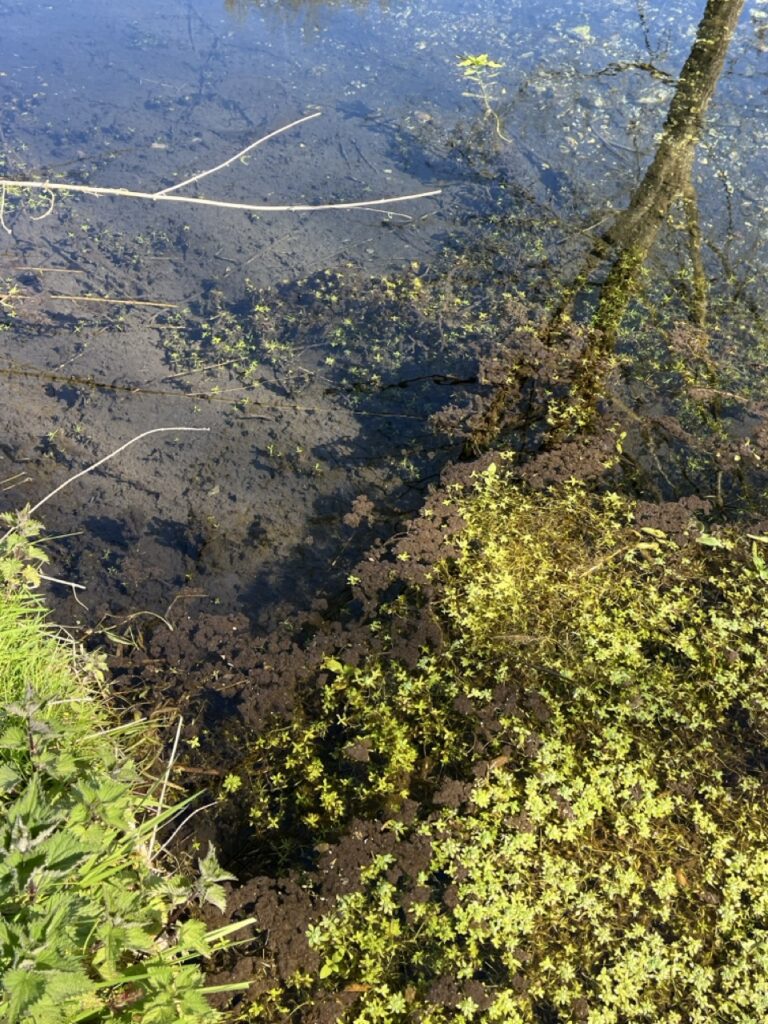
5. Some (increasing?) concern about sludge covering some of the gravel and also the ranunculus / crow foot near the Well source and down to Garrington bridge and A257. There’s a grimy poultry processing plant at Well (Turner’s Game) 50m from stream so I hope they have adequate wastewater systems in place.
Happy to answer any questions.
Tim
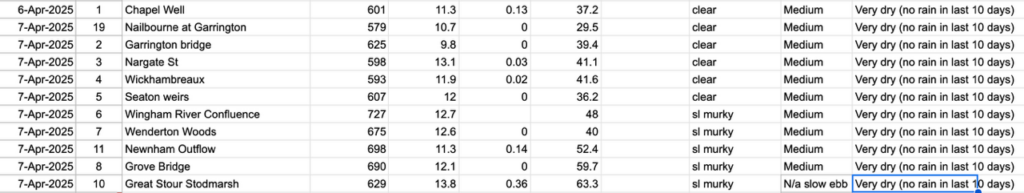
Key to columns : Date / Location and key / Conductivity / Temp / Phosphate / Nitrate / Clarity / Flow / Weather